The question every operations and HR leader is asking in 2025 is simple: How can we schedule employees, with the right skills, at the right time, without overspending or exhausting the team?
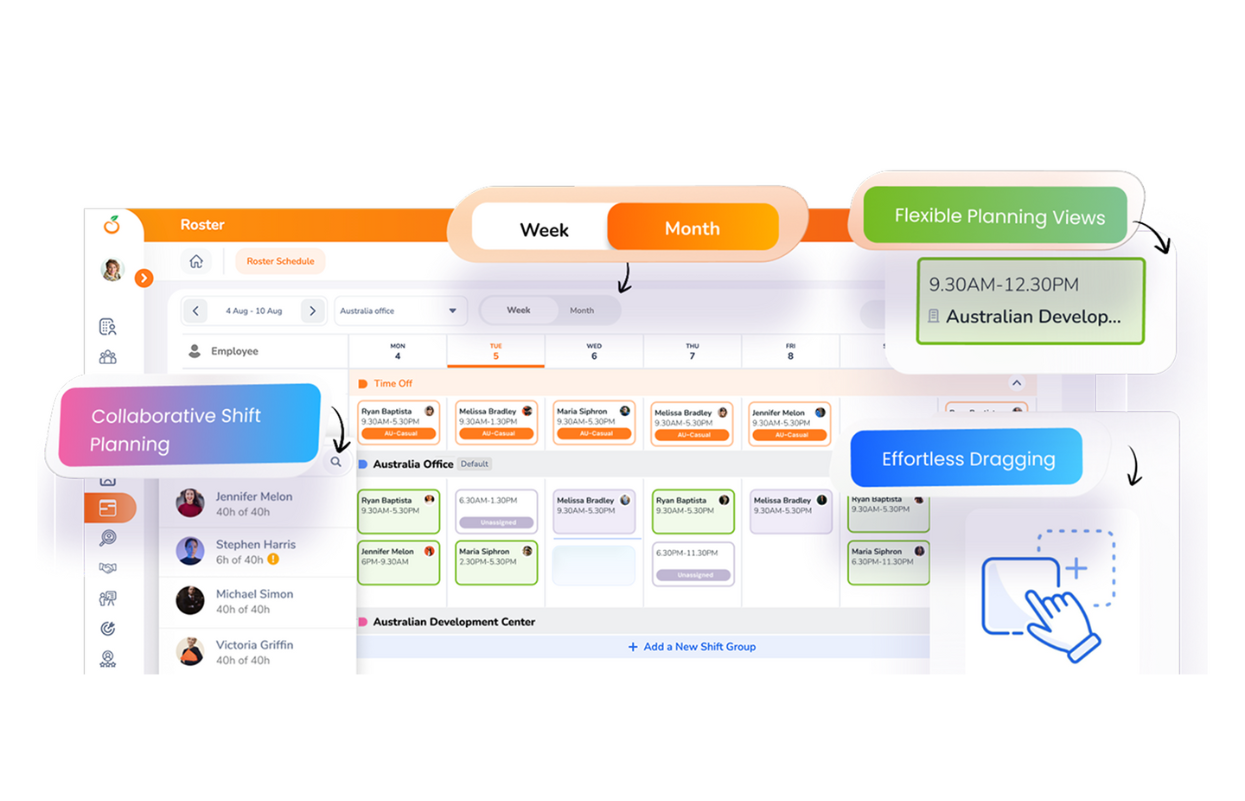
The answer is data-driven scheduling: using demand, skills, and compliance data to design rosters that align labor supply with real workload patterns. When you power this approach with a modern tool like OrangeHRM’s Roster Module, with clear visibility across teams and locations, flexible shift groups, live tracking of unpublished shifts, one-click publishing, and automated staff notifications, you transform scheduling from a weekly scramble into a continuous performance system.
Why 2025 Demands Data-Driven Scheduling
Several forces have converged to make “gut-feel” rostering risky and expensive:
-
Volatile demand: Spiky e-commerce volumes, fluctuating footfall, and campaign-driven peaks.
-
Hybrid operations: Distributed teams span locations and time zones; coverage must follow where the work is, not where the desks are.
-
Tighter margins: Every hour of avoidable labor spent erodes profitability.
-
Workforce expectations: Employees want predictability, fairness, and rapid communication when shifts change.
When rosters don’t reflect reality, the costs show up fast: missed SLAs, overtime bloat, churn, and poor customer experiences.
What “Data-Driven” Really Means
Data-driven scheduling isn’t just throwing analytics buzzwords at a timetable. It’s a closed loop:
Demand Signals (What’s coming)
-
Historical throughput by hour/day
-
Seasonality, promos, and event calendars
-
Pipeline indicators (bookings, tickets, reservations)
Workforce Data (What we have)
-
Skills, certifications, seniority
-
Availability, preferences, time-off
-
Productivity rates (units/hour, calls/hour)
Constraints (What we must respect)
-
Labor laws, rest periods, notice rules
-
Contract types and max weekly hours
-
Budget ceilings and cost targets
Outcomes (What success looks like)
-
Service levels hit at the lowest labor cost
-
Overtime and burnout are minimized
-
Fairness and employee experience are protected
Feedback Loops (How we improve)
-
Compare forecast vs. actuals
-
Adjust shift templates and staffing multipliers
-
Communicate changes quickly and clearly
The High Cost of Getting Rosters Wrong
|
Problem |
Business Impact |
Employee Impact |
|
Overstaffing in slow periods |
Unnecessary labor spend; idle time |
Boredom, disengagement |
|
Understaffing in peaks |
Lost sales, poor CX, SLA breaches |
Stress, burnout, and higher employee turnover |
|
Skills not matched to shifts |
Rework, quality issues |
Frustration, slow growth |
|
Last-minute changes, poor comms |
Chaos, absenteeism spike |
Distrust, work-life disruption |
|
Non-compliance with rules |
Fines, disputes, reputational harm |
Unfairness perception, grievances |
The Answer: A Practical Framework for Data-Driven Scheduling
Step 1: Consolidate the Right Data
-
Pull 13–18 months of hourly/daily demand (sales, orders, tickets, footfall).
-
Tag demand by location, channel, and work type.
-
Compile workforce profiles: skills/certs, productivity metrics, availability.
-
Capture constraints: legal limits, site policies, union rules, budget caps.
Step 2: Forecast Demand at the Right Granularity
-
Use moving averages or simple regression for a baseline.
-
Layer in seasonality (week-over-week, holiday shifts).
-
Translate demand into labor hours using productivity rates (e.g., 200 orders/hour ÷ 25 orders/agent/hour = 8 agent-hours).
Step 3: Design Shift Groups and Patterns
-
Build shift groups that map to predictable peaks (e.g., Early, Core, Late, Peak-Booster).
-
Set coverage targets for each day/slot (e.g., “Saturday 11:00–15:00 requires 14 associates”).
-
Create templates per location and role to reduce weekly rebuilds.
Step 4: Assign Skills and Optimize Coverage
-
Allocate must-have skills first (e.g., senior pharmacist per shift).
-
Fill the rest with productivity and availability.
-
Keep a bench (floaters/on-call) for known volatility windows.
Step 5: Publish, Notify, and Confirm
-
Publish once the plan clears checks; notify instantly.
-
Collect confirmations or conflicts early to avoid last-minute swaps.
-
Keep unpublished shifts visible to managers until finalized.
Step 6: Monitor and Adjust in Real Time
-
Track actual demand vs. forecast; redeploy if gaps emerge.
-
Log changes and rationale for auditability and learning.
Step 7: Review and Improve
-
Weekly retro: under/over coverage, overtime hot spots, fairness metrics.
-
Update shift groups and staffing multipliers based on actuals.
Where OrangeHRM Fits at Every Step
|
Framework Step |
OrangeHRM Roster Capability (How it Helps) |
|
Data consolidation & templating |
Full schedule view across teams, roles, and locations, managers see everything in one pane. |
|
Shift design (groups/patterns) |
Configure shift groups and assign team members to specific patterns, no admin or IT help required. |
|
Drafting & iteration |
All editable in a few clicks, fine-tune coverage as forecasts evolve. |
|
Publication & alignment |
Live tracking of unpublished shifts prevents missed assignments; one click publishes the final roster. |
|
Communication |
Automated email notifications to staff upon publication, everyone is aligned immediately. |
|
Governance & visibility |
Clear visibility into smart shift management and a clean audit trail of changes. |
In short, the framework is your operating model; OrangeHRM is the system of execution.
A Worked Example: Translating Demand to Staffing
Imagine a multi-site specialty retail chain with Saturday spikes.
Assumptions
-
Average transactions/hour (TXN/hr) by slot from last quarter
-
Avg. checkout + service time per transaction = 6 minutes total (0.10 hours)
-
Minimum floor roles: 1 supervisor, 1 inventory, 1 service pro in peak
|
Time Slot |
Forecast TXN/hr |
Labor Hours Needed (TXN/hr × 0.10) |
Base Headcount |
Skills Overlay (Min) |
Final Target |
|
09:00–11:00 Sat |
45 |
4.5 |
5 |
+1 supervisor |
6 |
|
11:00–15:00 Sat |
110 |
11.0 |
11 |
+1 supervisor +1 inv |
13 |
|
15:00–18:00 Sat |
80 |
8.0 |
8 |
+1 service pro |
9 |
|
18:00–20:00 Sat |
50 |
5.0 |
5 |
+0 |
5 |
With OrangeHRM shift groups, you’d pre-define Early/Core/Peak patterns, assign the skills overlay, draft coverage, track unpublished shifts, and publish once balanced. Staff receive instant emails, no chaser texts.
Industry Scenarios (and How the Roster Should React)
Retail & Quick-Service
-
Signals: POS hourly sales, footfall, promo calendar.
-
Roster moves: Add Peak-Booster shifts during promos; cross-skill checkout and replenishment.
-
OrangeHRM angle: Copy last promo’s shift group; tweak staffing multipliers; publish and notify.
Healthcare Outpatient
-
Signals: Appointment load by specialty, seasonal illnesses.
-
Roster moves: Ensure required clinical mix per hour; add float nurse during flu spikes.
-
OrangeHRM angle: Role-based shift groups with certs tagged; manager edits live as no-shows occur; instant updates to staff.
Contact Center
-
Signals: Ticket inflow, call arrival rates, marketing pushes.
-
Roster moves: Overlay language skills and senior SMEs during product launches.
-
OrangeHRM angle: Create launch-week shift group; track unpublished changes until QA sign-off; publish and alert agents.
Field Services & Logistics
-
Signals: Route density, weather, SLA windows.
-
Roster moves: Staggered starts; surge drivers during storms.
-
OrangeHRM angle: Location-specific groups; quick edits when weather warnings hit; automated emails confirm new starts.
Metrics That Matter (and How to Use Them)
|
KPI |
Definition/Formula |
Why It Matters |
Typical Target |
|
Coverage Accuracy |
Filled hours ÷ Required hours |
Ensures demand is actually met |
95–99% |
|
Labor Cost per Output Unit |
Total labor cost ÷ Units produced/served |
Links spend to value |
↓ vs baseline |
|
Overtime Rate |
OT hours ÷ Total hours |
Burnout and budget watch |
< 5–8% |
|
Schedule Stability |
# changes <24h before shift ÷ total shifts |
Predictability for employees |
< 10% |
|
Fairness Index |
Std dev of premium shifts per employee (lower = fairer) |
Prevents favoritism |
↓ over time |
|
Skill Coverage |
% of shifts meeting required skill mix |
Quality and compliance |
100% |
|
Absence Impact |
Tasks missed or delayed per absence per week |
Resilience of roster |
↓ over time |
Use these weekly in a 10-minute roster retro: celebrate improvements, diagnose misses, and adjust shift groups or staffing multipliers accordingly. OrangeHRM’s visibility and simple edits make the iteration loop fast.
Building the Right Shift Groups
Well-designed shift groups absorb everyday volatility without daily rebuilds.
-
Early/Open: Pre-open prep, inventory counts, first-hour service.
-
Core: Baseline coverage for steady periods.
-
Peak-Booster: Short, high-impact blocks aimed at known spikes.
-
Late/Close: Close-down, reconciliation, restocking.
-
Float/On-Call: Deploy within 60–120 minutes to handle surprise demand.
Tip: Keep Peak-Booster shifts 3–4 hours to reduce fatigue and maximize on-task time.
Communication Makes or Breaks the Plan
Even the best model fails if people don’t get the message in time.
-
Publish once; avoid multiple versions in inboxes.
-
Make it easy to acknowledge receipt or flag a conflict.
-
Provide a simple swap protocol to avoid manager bottlenecks.
-
Keep a single source of truth for the live roster.
OrangeHRM advantage: One-click publish and automated email notifications immediately align everyone. Managers can see who’s confirmed and what remains unpublished.
Compliance, Trust, and Transparency
Data-driven doesn’t mean people-blind:
-
Respect local labor laws (rest periods, max weekly hours, notice periods).
-
Track equitable access to premium shifts and weekends.
-
Honor availability and PTO; move exceptions through a clear approval path.
-
Maintain a lightweight audit trail of roster changes.
OrangeHRM’s clear visibility into shift management and change tracking reinforces fairness and reduces disputes.
Implementation: A 30/60/90-Day Rollout
First 30 Days: Foundations
-
Assemble demand and workforce data; clean and tag.
-
Define 3–5 shift groups per role; create initial templates.
-
Pilot in one location or team; collect feedback.
Days 31–60: Scale and Stabilize
-
Expand to 3–5 locations/teams.
-
Introduce weekly roster retros with the KPI table above.
-
Tighten the publish/notify/confirm cycle in OrangeHRM.
Days 61–90: Optimize and Automate
-
Refine staffing multipliers by time slot.
-
Introduce float/on-call rules for volatility windows.
-
Embed swap protocols and manager escalation paths.
Common Pitfalls (and How to Avoid Them)
-
Too many shift types: Keep groups simple; complexity breeds confusion.
-
Ignoring skills: Covering hours without the right capabilities hurts quality.
-
Late publishing: Staff need time; publish and notify as early as policy allows.
-
No feedback loop: If you don’t compare plan vs. actuals, you won’t improve.
-
One-person scheduling: Build a backup; document the process in OrangeHRM.
A Simple Weekly Operating Rhythm
-
Thursday: Draft roster using shift groups; check coverage and skills.
-
Friday morning: Review exceptions; finalize changes.
-
Friday afternoon: Publish in OrangeHRM; automated notifications go out.
-
Daily: Monitor actual vs. forecast; make minimal, well-communicated adjustments.
-
Monday 15 min: Roster retro, review KPIs, capture learnings, update templates.
This cadence keeps your plan stable for employees while preserving agility for the business.
How OrangeHRM Elevates Every Roster Cycle
-
Simple, flexible scheduling: Managers log in to a single view spanning teams, roles, and locations.
-
Shift groups that stick: Configure and reuse patterns without admin help.
-
Draft with confidence: Live tracking of unpublished shifts ensures nothing slips through.
-
One-click alignment: Publish instantly; automated email notifications keep everyone informed.
-
Continuous clarity: Clean visibility and an auditable trail build trust with teams and leadership.
Final Takeaway
How can companies build smarter rosters in 2025 that meet demand, protect margins, and keep people engaged?
Adopt a data-driven scheduling framework and execute it in OrangeHRM’s Roster Module. Use demand signals to forecast coverage, design reusable shift groups, assign for skills and fairness, publish once with automated notifications, and run a tight weekly feedback loop. The result is a roster that consistently places the right people, in the right seats, at the right times, maximizing performance without burning out teams.